Experiment metrics
AIchor records a set of per-experiment runtime metrics: CPU and memory, extensive DCGM GPU metrics (compute, CUDA cores, Tensor Cores, memory, interconnect, power and thermal, errors and health), disk, and network.
The same data is available in two places:
- The Monitoring tab on the experiment page in AIchor UI in the web app, for interactive browsing, charts, and a per-pod resource summary.
- The AIchor CLI, from version 3.5.0 onwards, under
aichor experiments metrics. It provides metric information, the same summary, plotting capability, and machine-readable (-o json) output that fits into scripts.
Per-experiment metrics are a recent addition and are still being refined. The set of metrics, the recording interval (currently one sample every 30 seconds), and the fair-use limits may change as the service is used. If a limit is repeatedly reached during ordinary work, or a finer interval than 30 seconds would help, that is worth reporting rather than working around.
What is collected
Metrics are organised into groups. A group can be selected as a whole in both the web app and the CLI.
| Group | Slug | What it covers |
|---|---|---|
| CPU and memory | cpu | Host-side CPU and memory per pod: cores used, use as a fraction of the pod's request and limit, plus health signals (CPU throttling, out-of-memory kills, container restarts). This is the data-loading and pre-processing side of a run, not the GPU. |
| GPU compute | gpu-compute | Overall GPU busyness: SM activity and occupancy, the legacy utilisation gauge, the SM clock, and a per-GPU bottleneck timeline that classifies why each GPU is (or is not) doing useful work. |
| GPU CUDA cores | gpu-cuda-cores | Utilisation of the FP32 and FP64 arithmetic pipes, the "CUDA core" math as distinct from the Tensor Cores. High here with low Tensor Core activity means single or double precision rather than mixed-precision matmuls. |
| GPU Tensor Cores | gpu-tensor-cores | Tensor Core utilisation, split by precision (FP16/BF16, INT8, FP64). The key throughput signal for mixed-precision training; near zero on a training job usually means the mixed-precision path is not engaged. |
| GPU memory | gpu-memory | Device-memory pressure and bandwidth: VRAM in use and as a percentage of capacity, how busy the memory interface is, and memory temperature. |
| GPU interconnect | gpu-interconnect | Data movement to and from the GPU over PCIe and NVLink, plus their link-error counters. Drives multi-GPU collective performance. |
| GPU power and thermal | gpu-power-thermal | Power draw, cumulative energy, temperature, throttle reasons, and the share of wall-time clocks were held down by power or thermal limits. |
| GPU errors and health | gpu-errors-health | Hardware-fault counters: XID errors, uncorrectable ECC errors, and remapped memory rows. These are expected to stay at zero; non-zero values point to failing hardware. |
| Disk | disk | Per-pod container filesystem throughput and IOPS (reads and writes). Relevant when the dataset is read from disk every step rather than cached in memory. |
| Network | network | Per-pod and total NIC throughput on the standard (non-RDMA) interfaces, as both rates and cumulative totals. |
In the web app
The Monitoring tab on the experiment page has two views:
- Metrics draws each selected metric as a time-series chart, one line per series (per pod, per pod and GPU, or per node). The charts share a time range and zoom together.
- Summary gives a per-pod, right-sizing read of the run: how each pod's CPU, memory, and GPU compare to what it reserved, alongside health signals (CPU throttling, out-of-memory kills, restarts, and GPU state).
Selecting what to see
The controls above the charts narrow what is drawn:
- Metrics selects which metrics, or whole group, are charted. The default is a representative subset rather than every metric at once; the selector shows how many of the total are active (for example 14 / 49).
- Pods, GPUs, and Nodes filter the series down to specific ones.
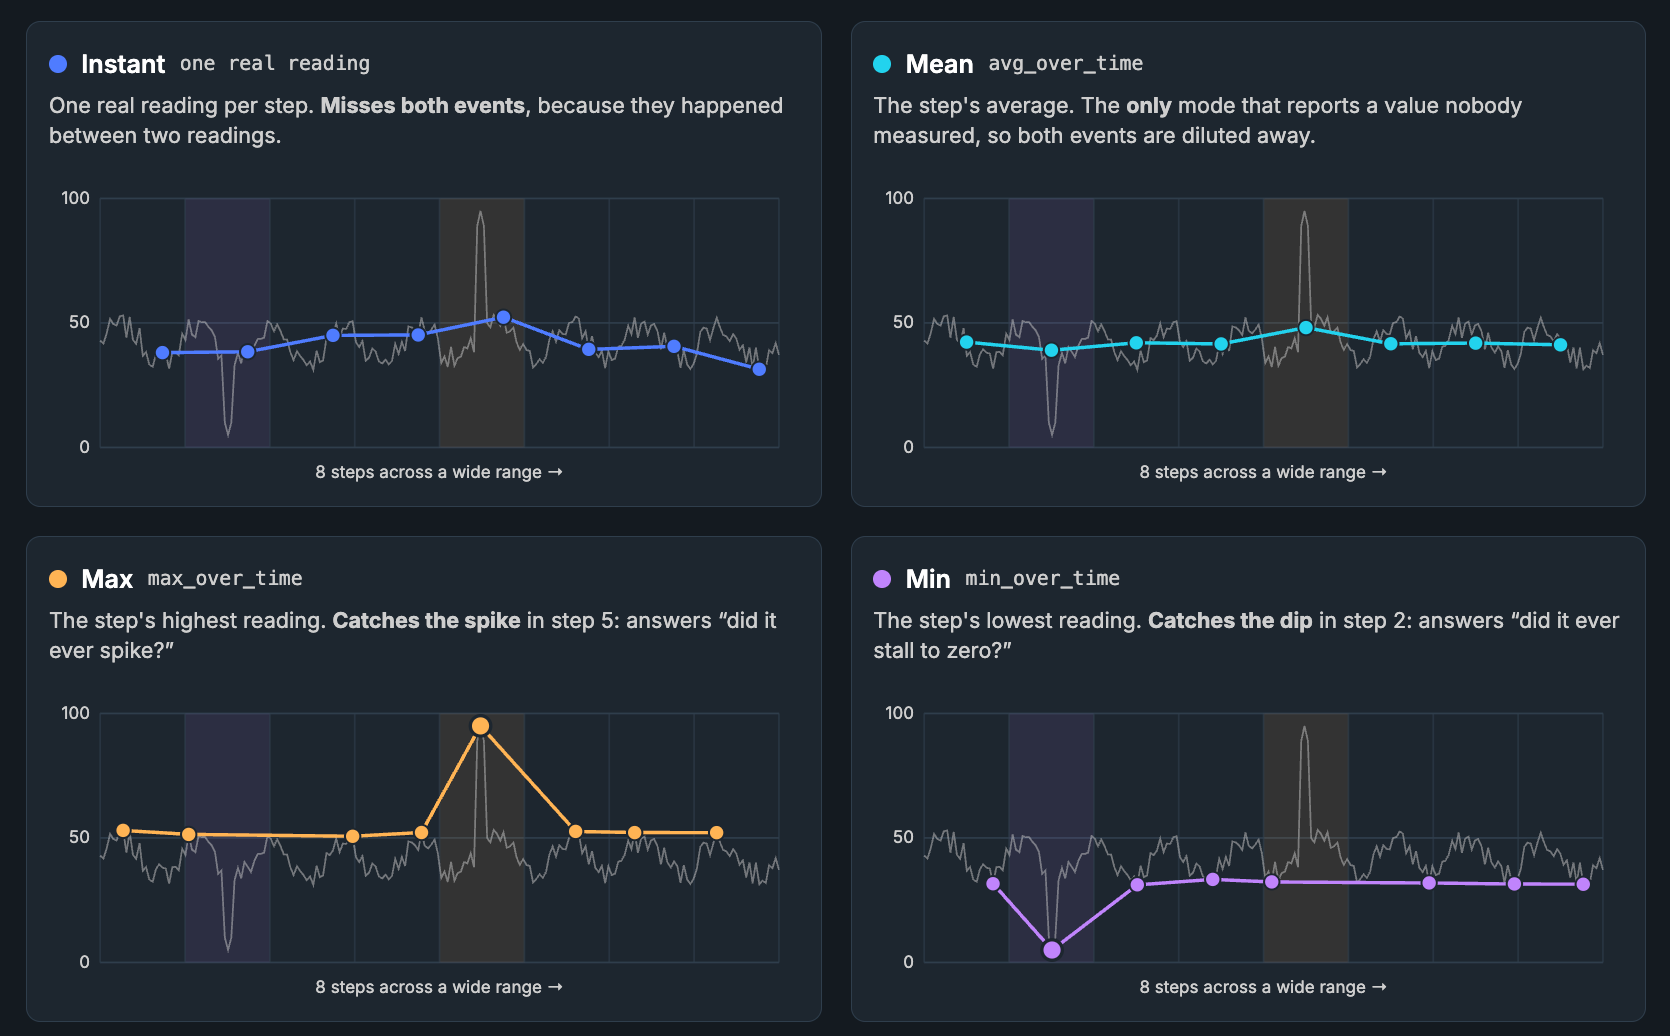
- Aggregation sets what each point represents over its time bucket: Instant (the last real sample), Mean, Max, or Min. Max surfaces a brief spike and Min a short dip; Instant can step over either on a wide range (see Time ranges and resolution).
- The time range control selects a trailing window (such as the last 15 minutes) or an absolute span. A live experiment can auto-refresh as new data arrives.
Each request is priced, so selecting more metrics or groups, a wider range, or an aggregation instead of an instant reading makes it costlier. See Fair use.
The Guide menu in the Monitoring tab is the built-in reference for reading a run. It explains what each metric means and walks through common patterns with their likely causes and things to try, for example a mostly-idle GPU while CPU or disk are busy (which points at the input pipeline rather than the model).
Sharing views
The share control, immediately left of Guide, copies the current view as a yg1:... token.This token can be shared with other people and applying reproduce the copied view. Only settings
travel (sub-tab, time range and timezone, aggregation, selected metrics), so a token grants
no access, carries no data, and is not tied to one experiment. Pod, GPU and node filters and
chart zoom reset on import, since they name things belonging to a single run.
With the CLI
Every command lives under aichor experiments metrics. This is a short overview; the
CLI command reference documents
every flag.
getprints the selected metrics as a compact table (last, minimum, mean, and maximum value plus a sparkline trend), one row per series.summarygives the same per-pod right-sizing view as the Summary tab, over the whole run by default.cataloguelists the groups and metrics that exist. It is static and needs no running experiment.plotrenders a single metric to an image, or to a self-contained interactive HTML chart with--export.
# List the groups, or one group's metrics
aichor experiments metrics catalogue --group
aichor experiments metrics catalogue --group gpu-memory

# Read metrics as a table, by key (-m) or by group (--group)
aichor experiments metrics get <experiment-id> --group gpu-compute
aichor experiments metrics get <experiment-id> -m cpu_usage -m memory_usage --window 6h

# Per-pod right-sizing summary
aichor experiments metrics summary <experiment-id>

# Plot a single metric and open it
aichor experiments metrics plot <experiment-id> -m gpu_memory_used --open
Metrics are selected by key (-m) or by group (--group), and several are read at
once by repeating either flag. Every metric has a key (shown by catalogue) and
belongs to one group whose slug is listed in the table above.
Time ranges and resolution
The web app and the CLI share the same idea of a time range: a trailing window (such
as 30m, 1h, or 4d), an absolute start/end span, or the whole run. The CLI spells
these as --window, --start/--end, and --lifetime; see
Selecting a time range for the exact
flags.
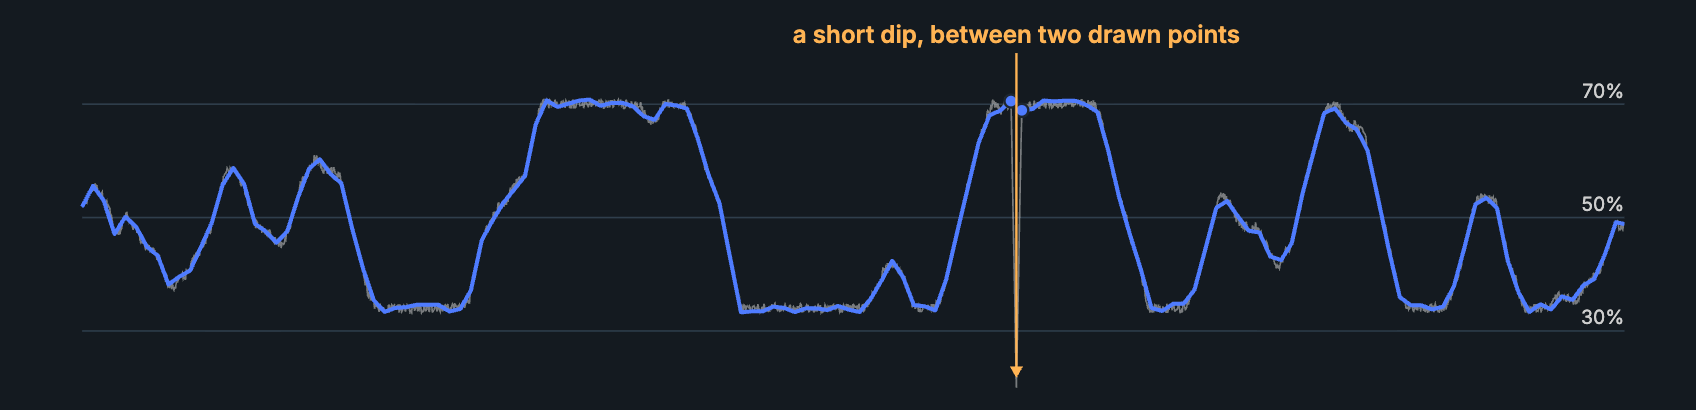
One point applies regardless of which tool is used. The resolution (how far apart the data points are) is chosen from the width of the time range, not by the client. A wide window is deliberately coarsened: roughly the same number of points is spread across a much longer span, so each point covers more time. This keeps the amount of data transmitted roughly constant while the line still follows the same shape.
Wide ranges draw fewer points, and refresh less often
A chart does not draw every reading. Readings are recorded every 30 seconds, but a chart is only a few hundred pixels wide, so a week of them would be over 20,000 points crammed into a few hundred columns. Any time range is instead split into roughly 600 points: the wider the range, the more time each point covers. The refresh follows the same logic, since there is no reason to refetch a chart before its next point is even due.
| Time range | One point covers | Chart refreshes |
|---|---|---|
| 1 hour | 30 seconds | every 30 seconds |
| 6 hours | 30 seconds | every 30 seconds |
| 24 hours | 2.5 minutes | every 2.5 minutes |
| 7 days | 17 minutes | every 17 minutes |
| 30 days | 72 minutes | every 72 minutes |
This is usually fine, for three reasons:
- Very little is actually lost. A coarser point is still a real reading, not a guess, and on a wide chart the extra readings would mostly land on pixels that are already drawn.
- Short peaks and dips can still be found. With the aggregation set to Max or Min (below), each point becomes the highest or lowest reading in its interval, so a brief spike survives even on a month-wide chart.
- A wide range is for looking at the past, not the present. A slower refresh only matters when watching what is happening right now, and for that the right range is 15 minutes to an hour, where points are already at their finest and the refresh is quick.
The 30-second interval and the point budgets above are an initial approach. If a run needs finer-grained metrics than this, reach out to the AIchor team and it can be looked into.
Aggregation: what each point means
- By default each point is an instant reading, the last real sample at that mark. Over a wide, coarsened window a brief spike or a short dip that falls between two marks can be stepped over and never appear, so an instant reading on a wide window reflects the general level rather than every outlier.
- Changing the aggregation surfaces those outliers: Max shows the highest value in
each bucket (a spike, a memory peak), Min the lowest (a stall, an idle gap), and
Mean the bucket average. In the CLI this is
--agg max|min|mean.
Error and event metrics are an exception on both counts. They keep a finer point spacing on purpose, because a brief error is worthless if it is smoothed away, so a chart that includes one refreshes more often than the table above suggests. They also always render instant and ignore the aggregation, since a bucket average or maximum of a running total (cumulative energy, error counters, out-of-memory events, throttle reasons) is not meaningful.
Fair use
Each query carries a cost and that cost is kept fair across users. A query costs more when it reads more metrics (or whole groups), a wider time range, or an aggregation (Mean, Max, or Min) rather than a plain instant reading. The error and event metrics (non-cumulative signals such as OOM events and throttle reasons) also cost a little more on their own, because they are kept at a finer resolution, and so carry more points per series, so that a brief event is not smoothed away and missed. A per-user allowance refills over time; a query that would exceed it is refused with a "too many requests" response and a suggested retry delay, rather than slowing the service for everyone.
Staying within budget is straightforward: select only the metrics or groups actually needed, keep the window no wider than the question requires, and reserve the aggregation modes for when a peak or a dip specifically needs to be caught. These limits are still being tuned, so hitting one during ordinary work is worth reporting (see the note at the top of this page).