Debug Tools
Terminal
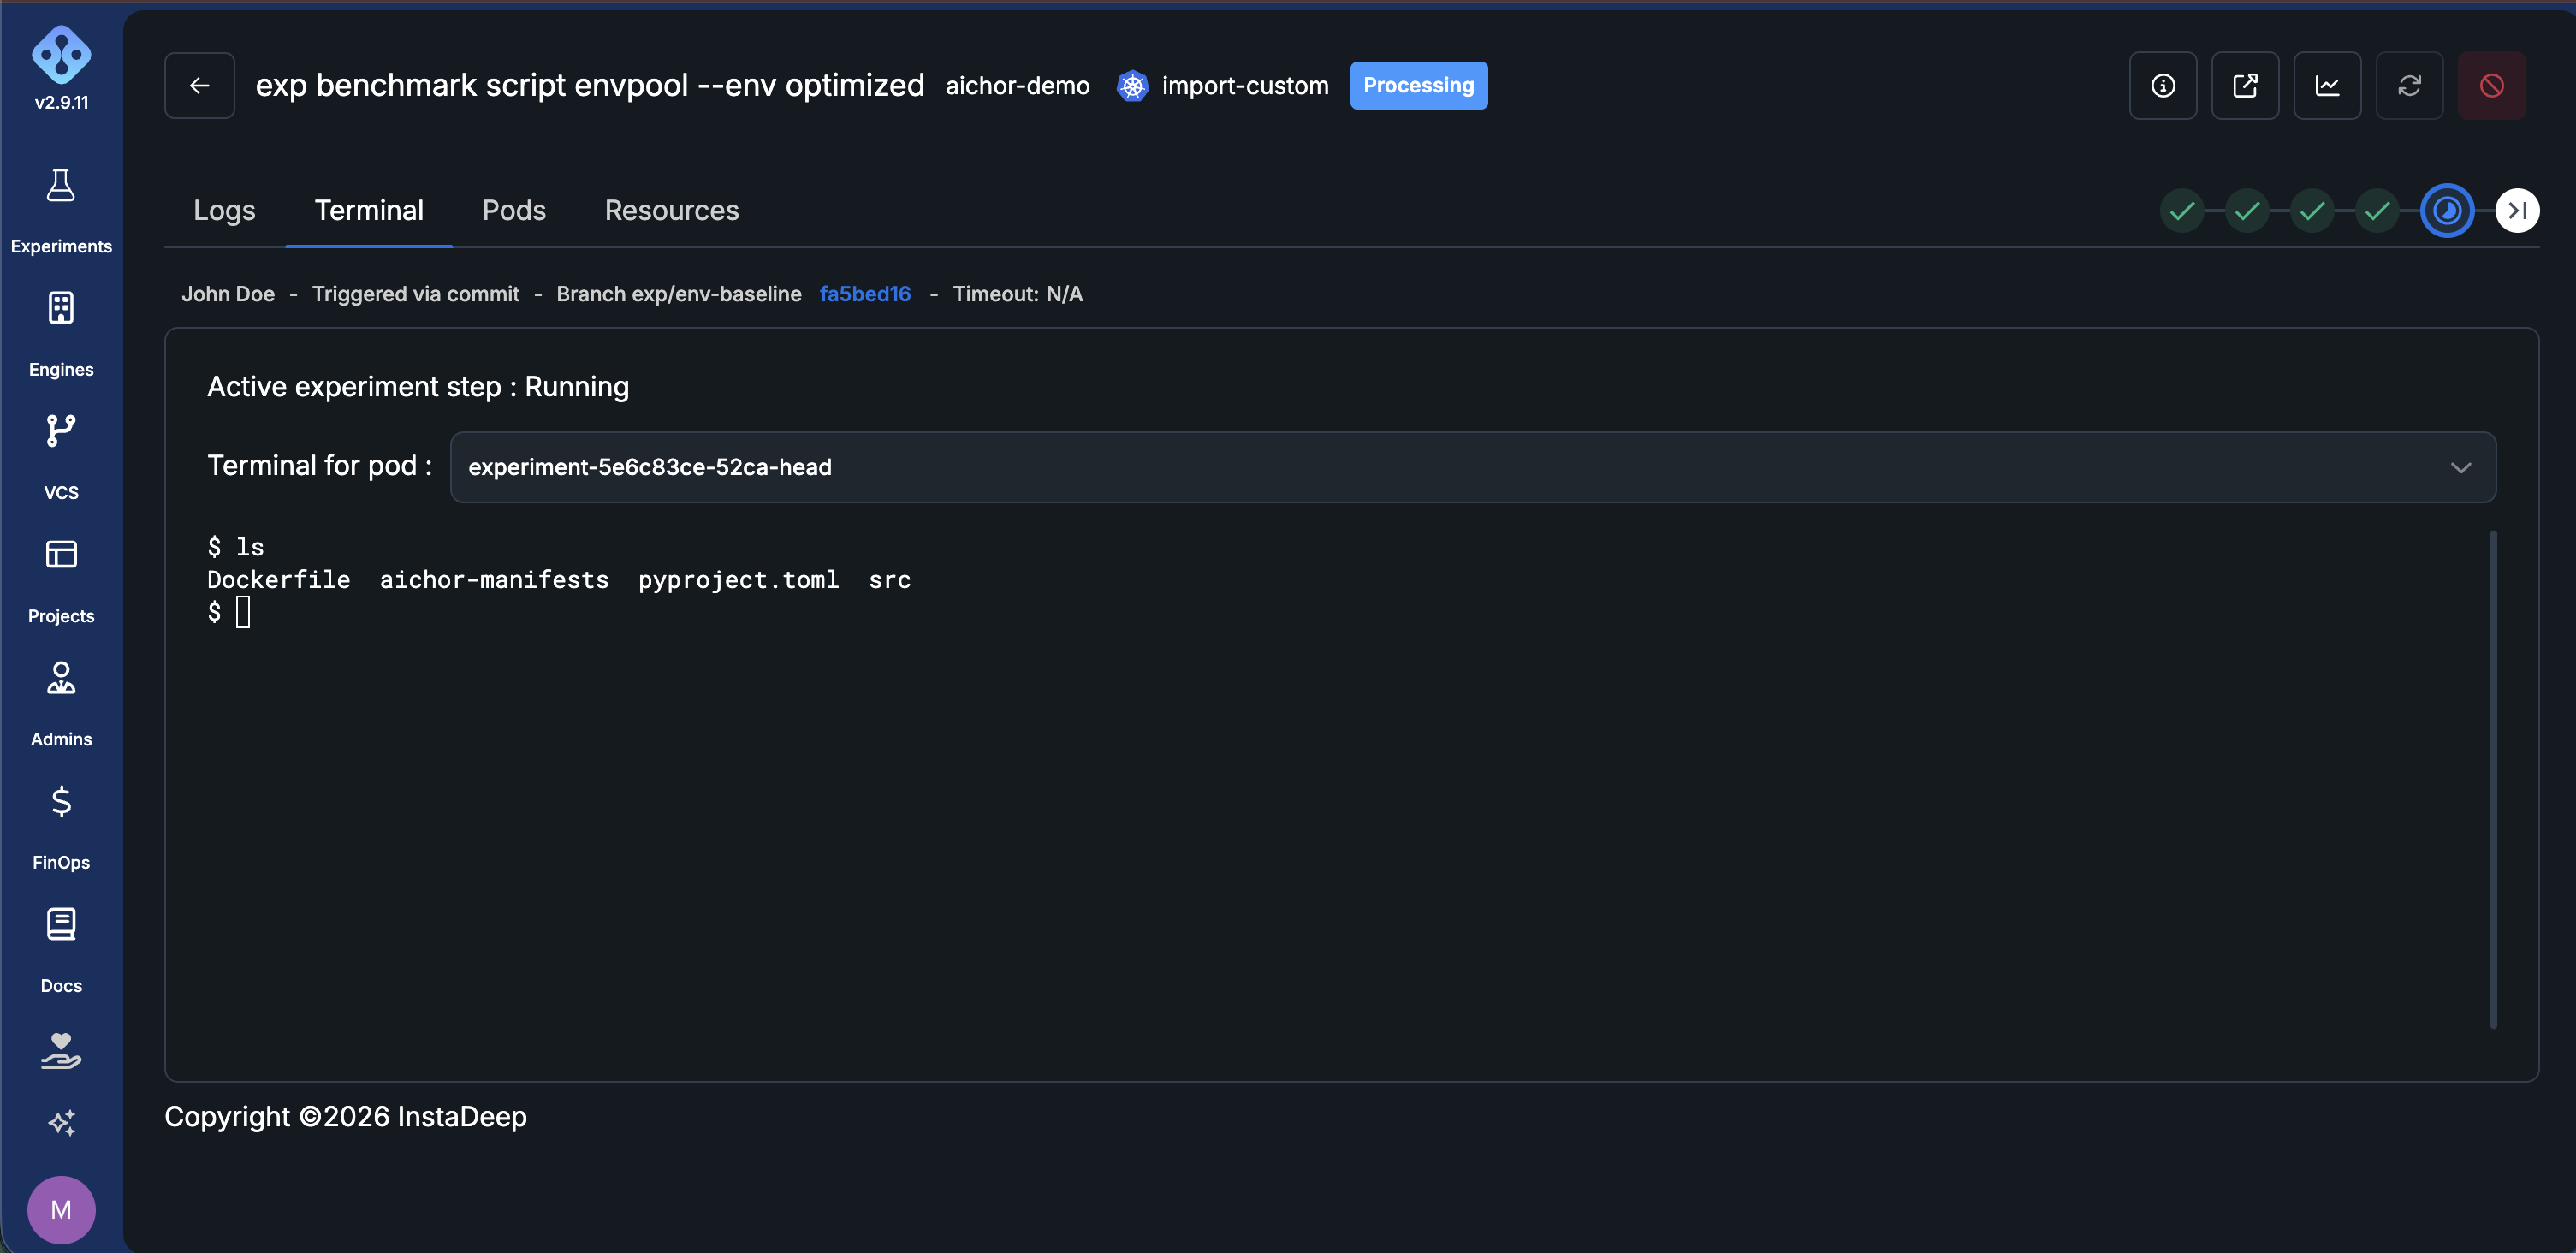
AIchor allows users to access a running pod through a terminal, in order to debug an experiment or for any other purpose.
The terminal requires a shell to be present in the experiment's image (at /bin/sh). Minimal or scratch-based images that ship without one cannot open a terminal.

Interactive debugging with Visual Studio Code and Cursor
The terminal feature provides access to running pods for debugging from the AIchor UI, but its capabilities are limited compared to a full IDE.
AI engineers often need to debug their code in a more user-friendly environment, with the IDE tools that enable efficient work.
For this, AIchor supports connecting to a running pod from a local machine through VS Code or Cursor.
User requirements
This feature only requires either:
- a GitHub account, or
- a Microsoft account
The account is used for authentication only.
Code requirements
The Visual Studio Code binary must be present in the experiment's image — for example, by adding this Dockerfile stage:
FROM alpine/curl AS vscode-installer

RUN mkdir /aichor
RUN curl -Lk 'https://code.visualstudio.com/sha/download?build=stable&os=cli-alpine-x64' --output /aichor/vscode_cli.tar.gz
RUN tar -xf /aichor/vscode_cli.tar.gz -C /aichor


# Project's Dockerfile content, for example
FROM pytorch/pytorch:2.4.1-cuda12.4-cudnn9-runtime
# ...
# Project's Dockerfile content

# Copy the vscode binary on the final Dockerfile stage at '/aichor'
# binary won't be findable in $PATH, it'll just be located at '/aichor/code'
COPY --from=vscode-installer /aichor /aichor
For Cursor, the Dockerfile should be adjusted as follows:
FROM alpine/curl AS cursor-installer

RUN mkdir /aichor
RUN curl -L 'https://api2.cursor.sh/updates/download-latest?os=cli-alpine-x64' --output /aichor/cursor.tar.gz
RUN tar -xf /aichor/cursor.tar.gz -C /aichor

# Project's Dockerfile content, for example
FROM pytorch/pytorch:2.4.1-cuda12.4-cudnn9-runtime
# ...
# Project's Dockerfile content

# Copy the vscode binary on the final Dockerfile stage at '/aichor'
# binary won't be findable in $PATH, it'll just be located at '/aichor/code'

COPY --from=cursor-installer /aichor /aichor
VS Code debug mode is enabled in the manifest:
...
spec:
  ...
  debug:
    vscode:
      enabled: true # required
      path: "/aichor/code" # Optional, defaults to "code". Refer the absolute path of the binary if not findable in $PATH
      provider: "github" # Optional, vscode tunnel provider. Options are "github" or "microsoft", defaults to "github"
...
For Cursor, the manifest changes are:
...
spec:
  ...
  debug:
    vscode:
      enabled: true # required
      path: "/aichor/cursor" # Optional, defaults to "code". Refer the absolute path of the binary if not findable in $PATH
      provider: "github"
...
For example, using GitHub: once the experiment is running, the logs should contain a line similar to:
To grant access to the server, please log into https://github.com/login/device and use code XXXX-XXXX
Follow the link, enter the code, and authorize GitHub. The VS Code tunnel then opens with GitHub, and more logs appear:
*
* Visual Studio Code Server
*
* By using the software, you agree to
* the Visual Studio Code Server License Terms (https://aka.ms/vscode-server-license) and
* the Microsoft Privacy Statement (https://privacy.microsoft.com/en-US/privacystatement).
*
[2025-02-24 14:25:24] info Creating tunnel with the name: 8e68f47f-6e08-mhTrZ
Open this link in your browser https://vscode.dev/tunnel/8e68f47f-6e08-mhTrZ/opt/app
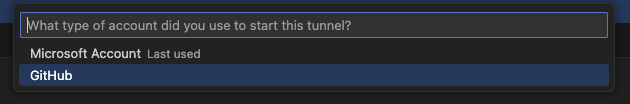
Click the vscode.dev link to open VS Code, then select GitHub to connect to the tunnel.
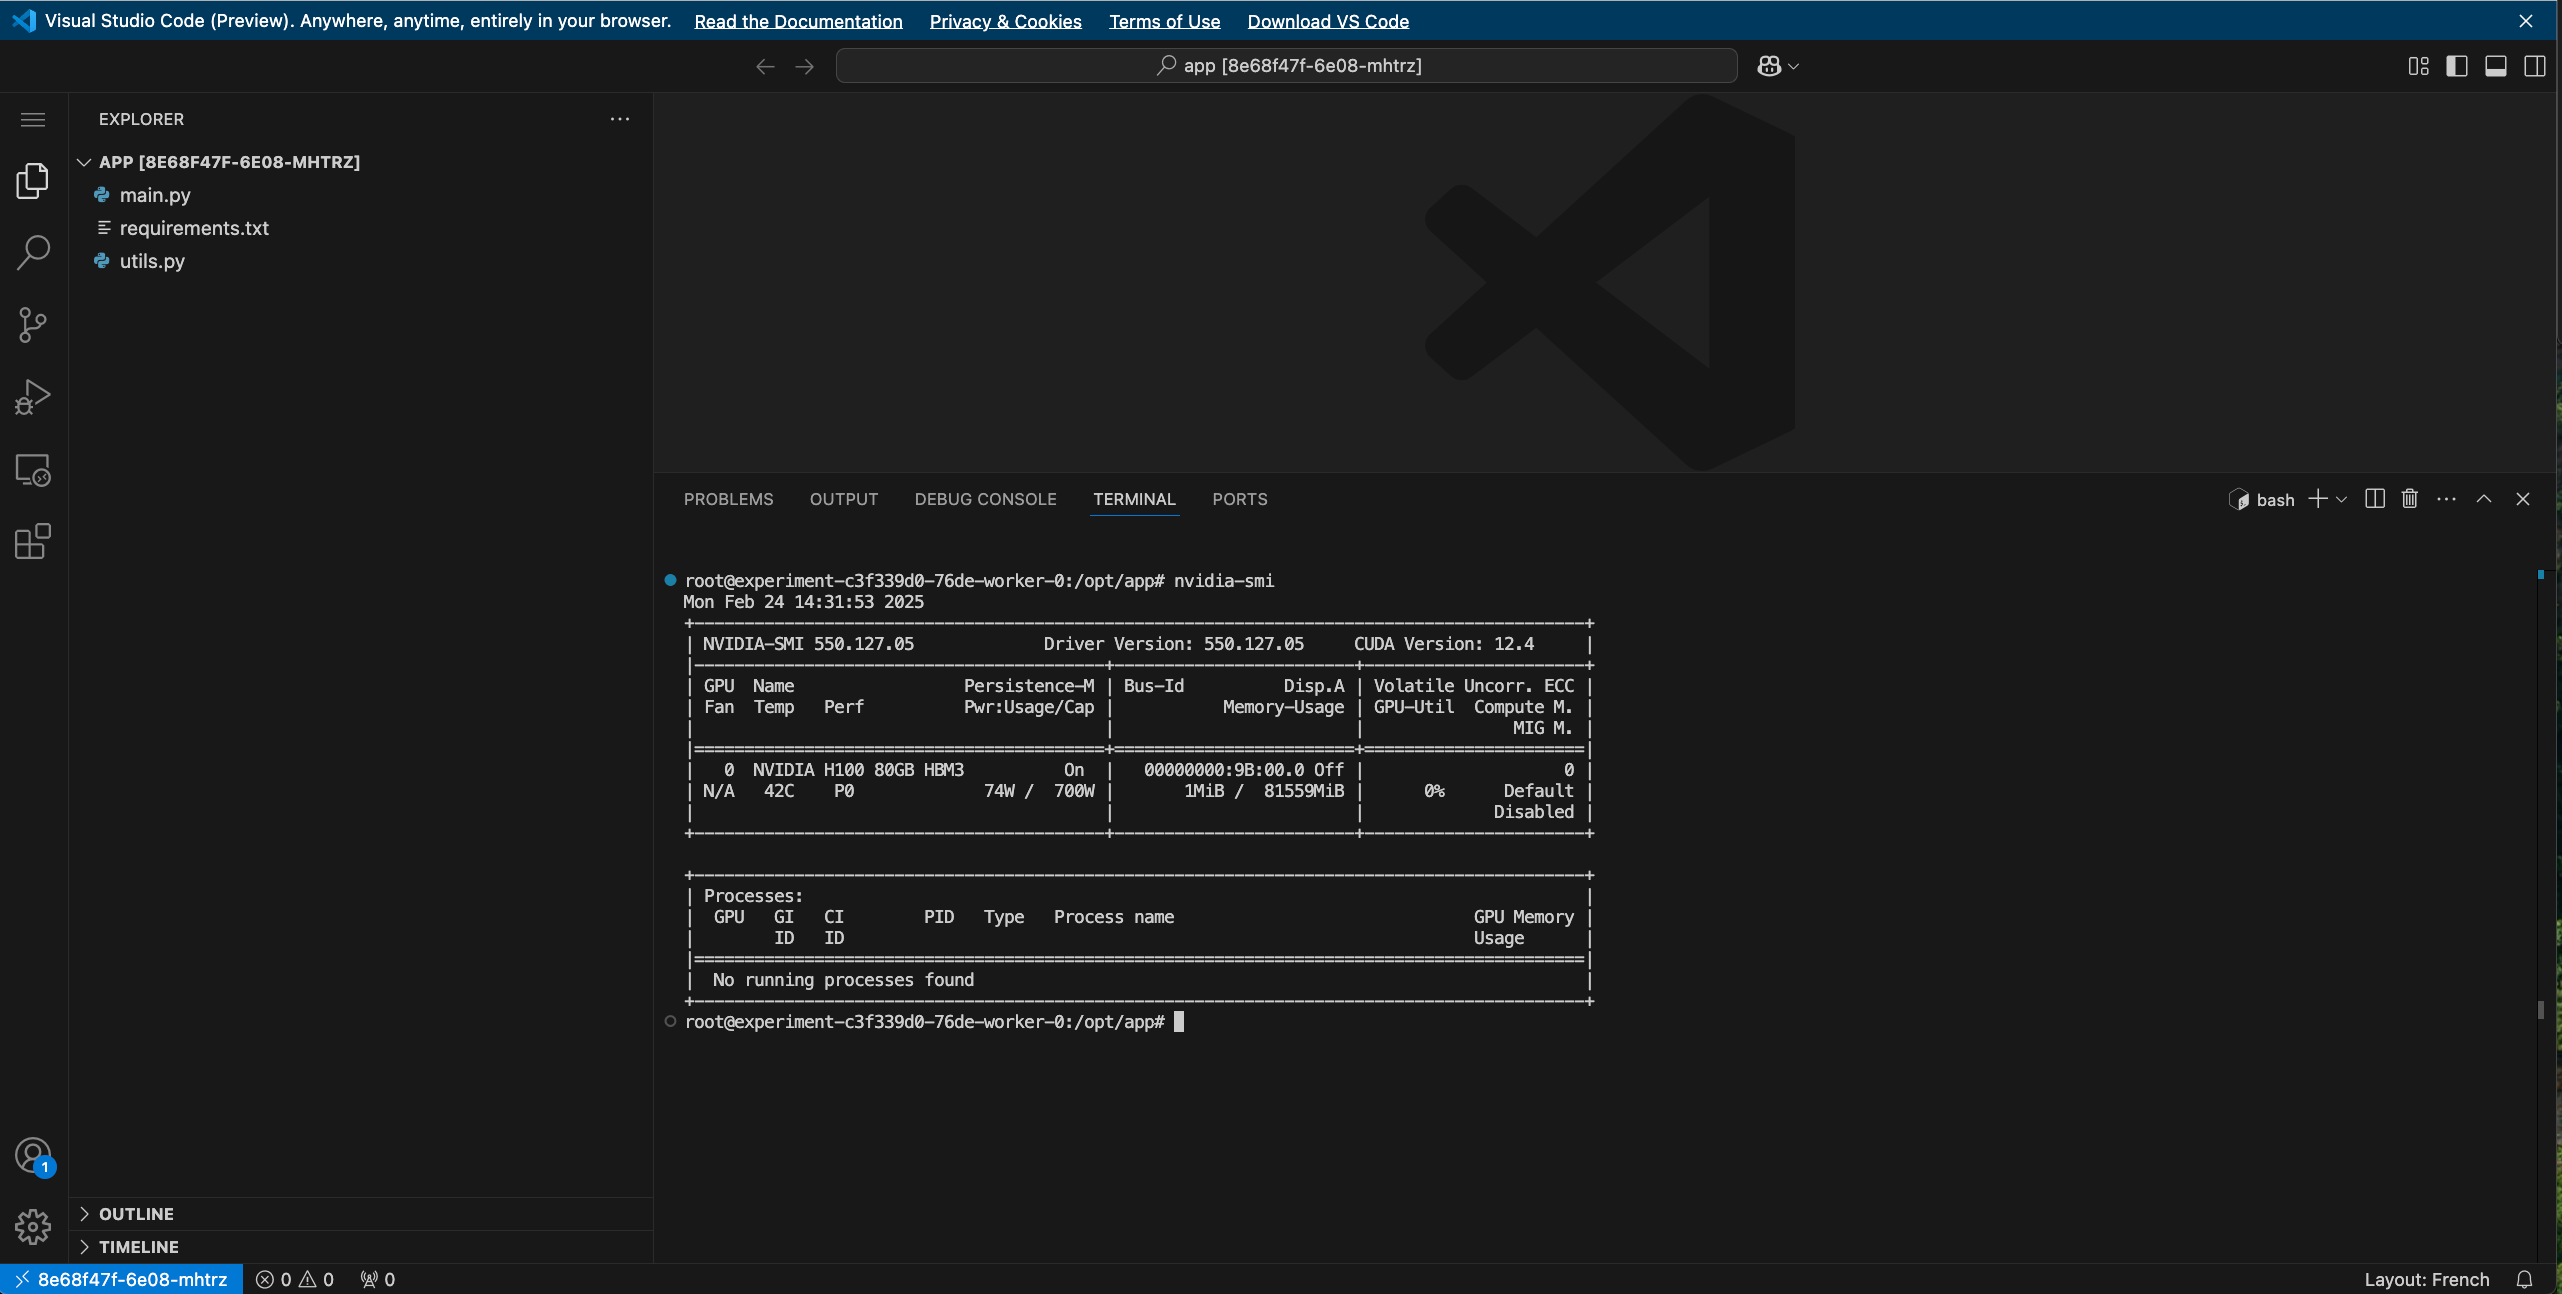
The experiment's files and terminal should now be accessible:
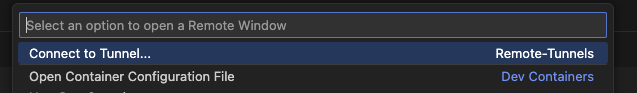
The tunnel can also be reached from the VS Code desktop app. Launch the app and click the button to set up a remote connection:

Select "Connect to tunnel":
Log in with GitHub and select the tunnel; it should show an "Online" flag:

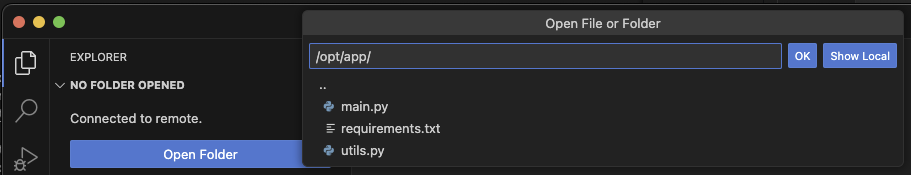
VS Code opens at ~, which usually doesn't contain the experiment's files. They can be opened by selecting "Open Folder" and entering the path:
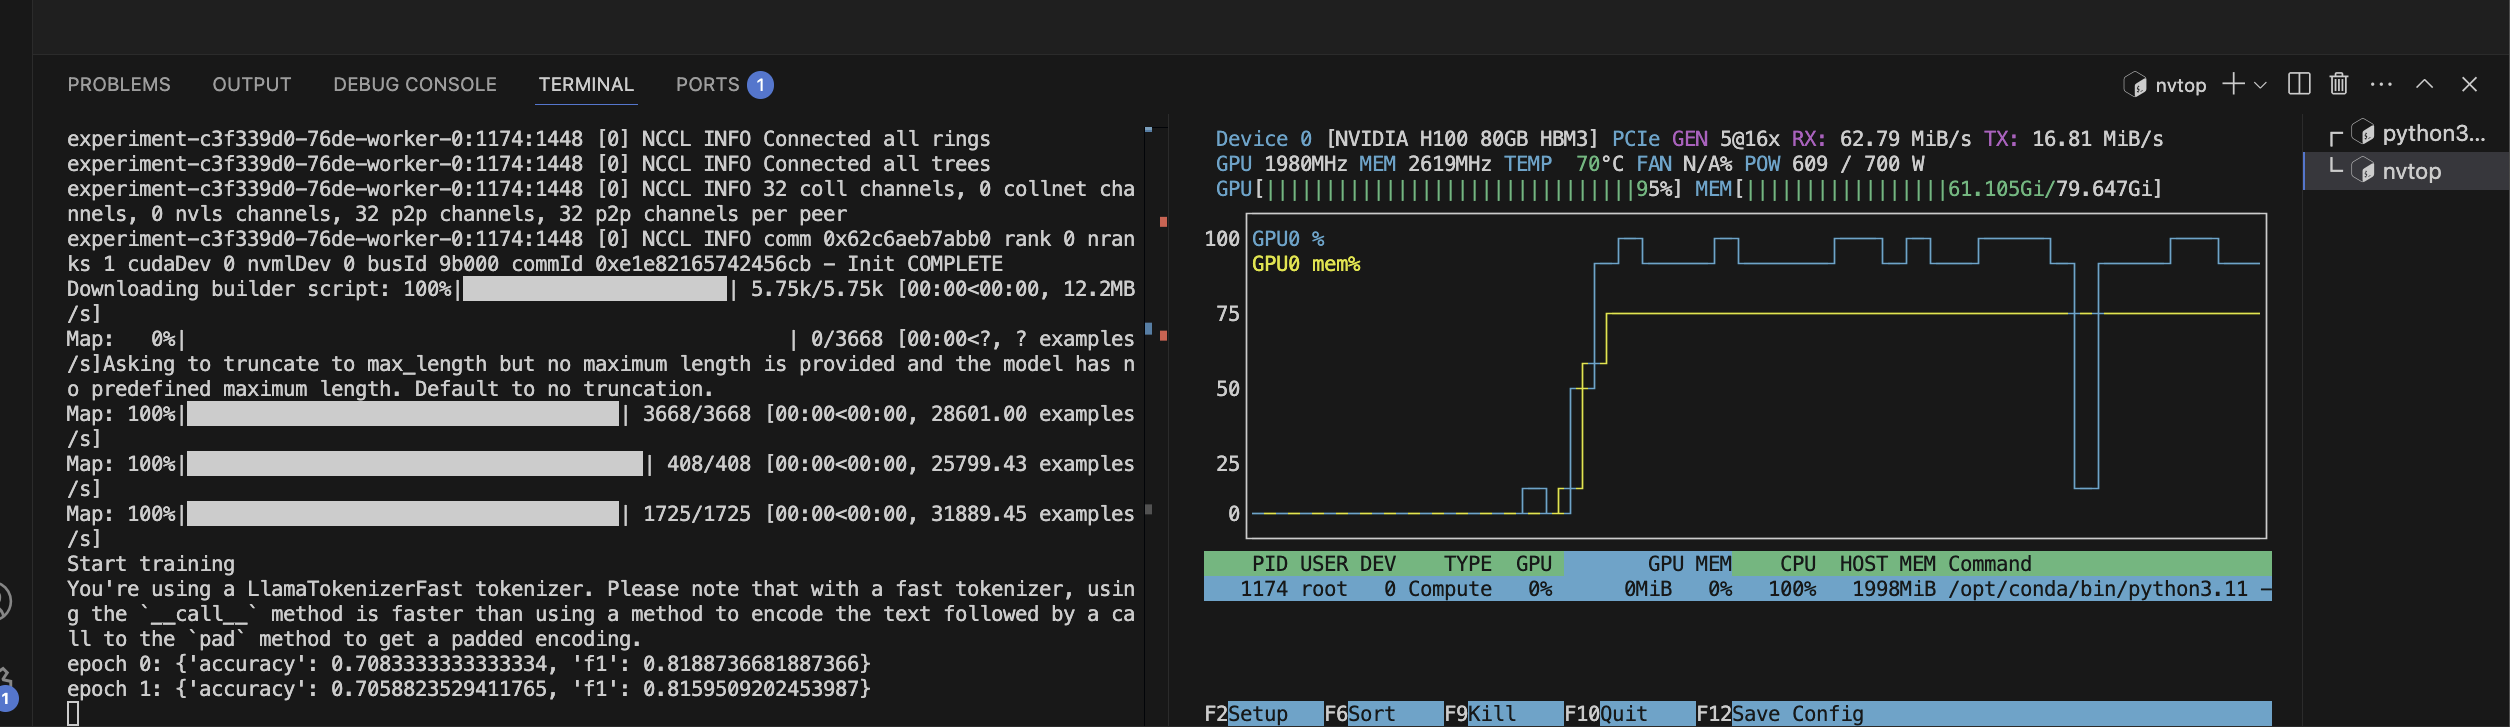
The code and the requested compute can now be used interactively:
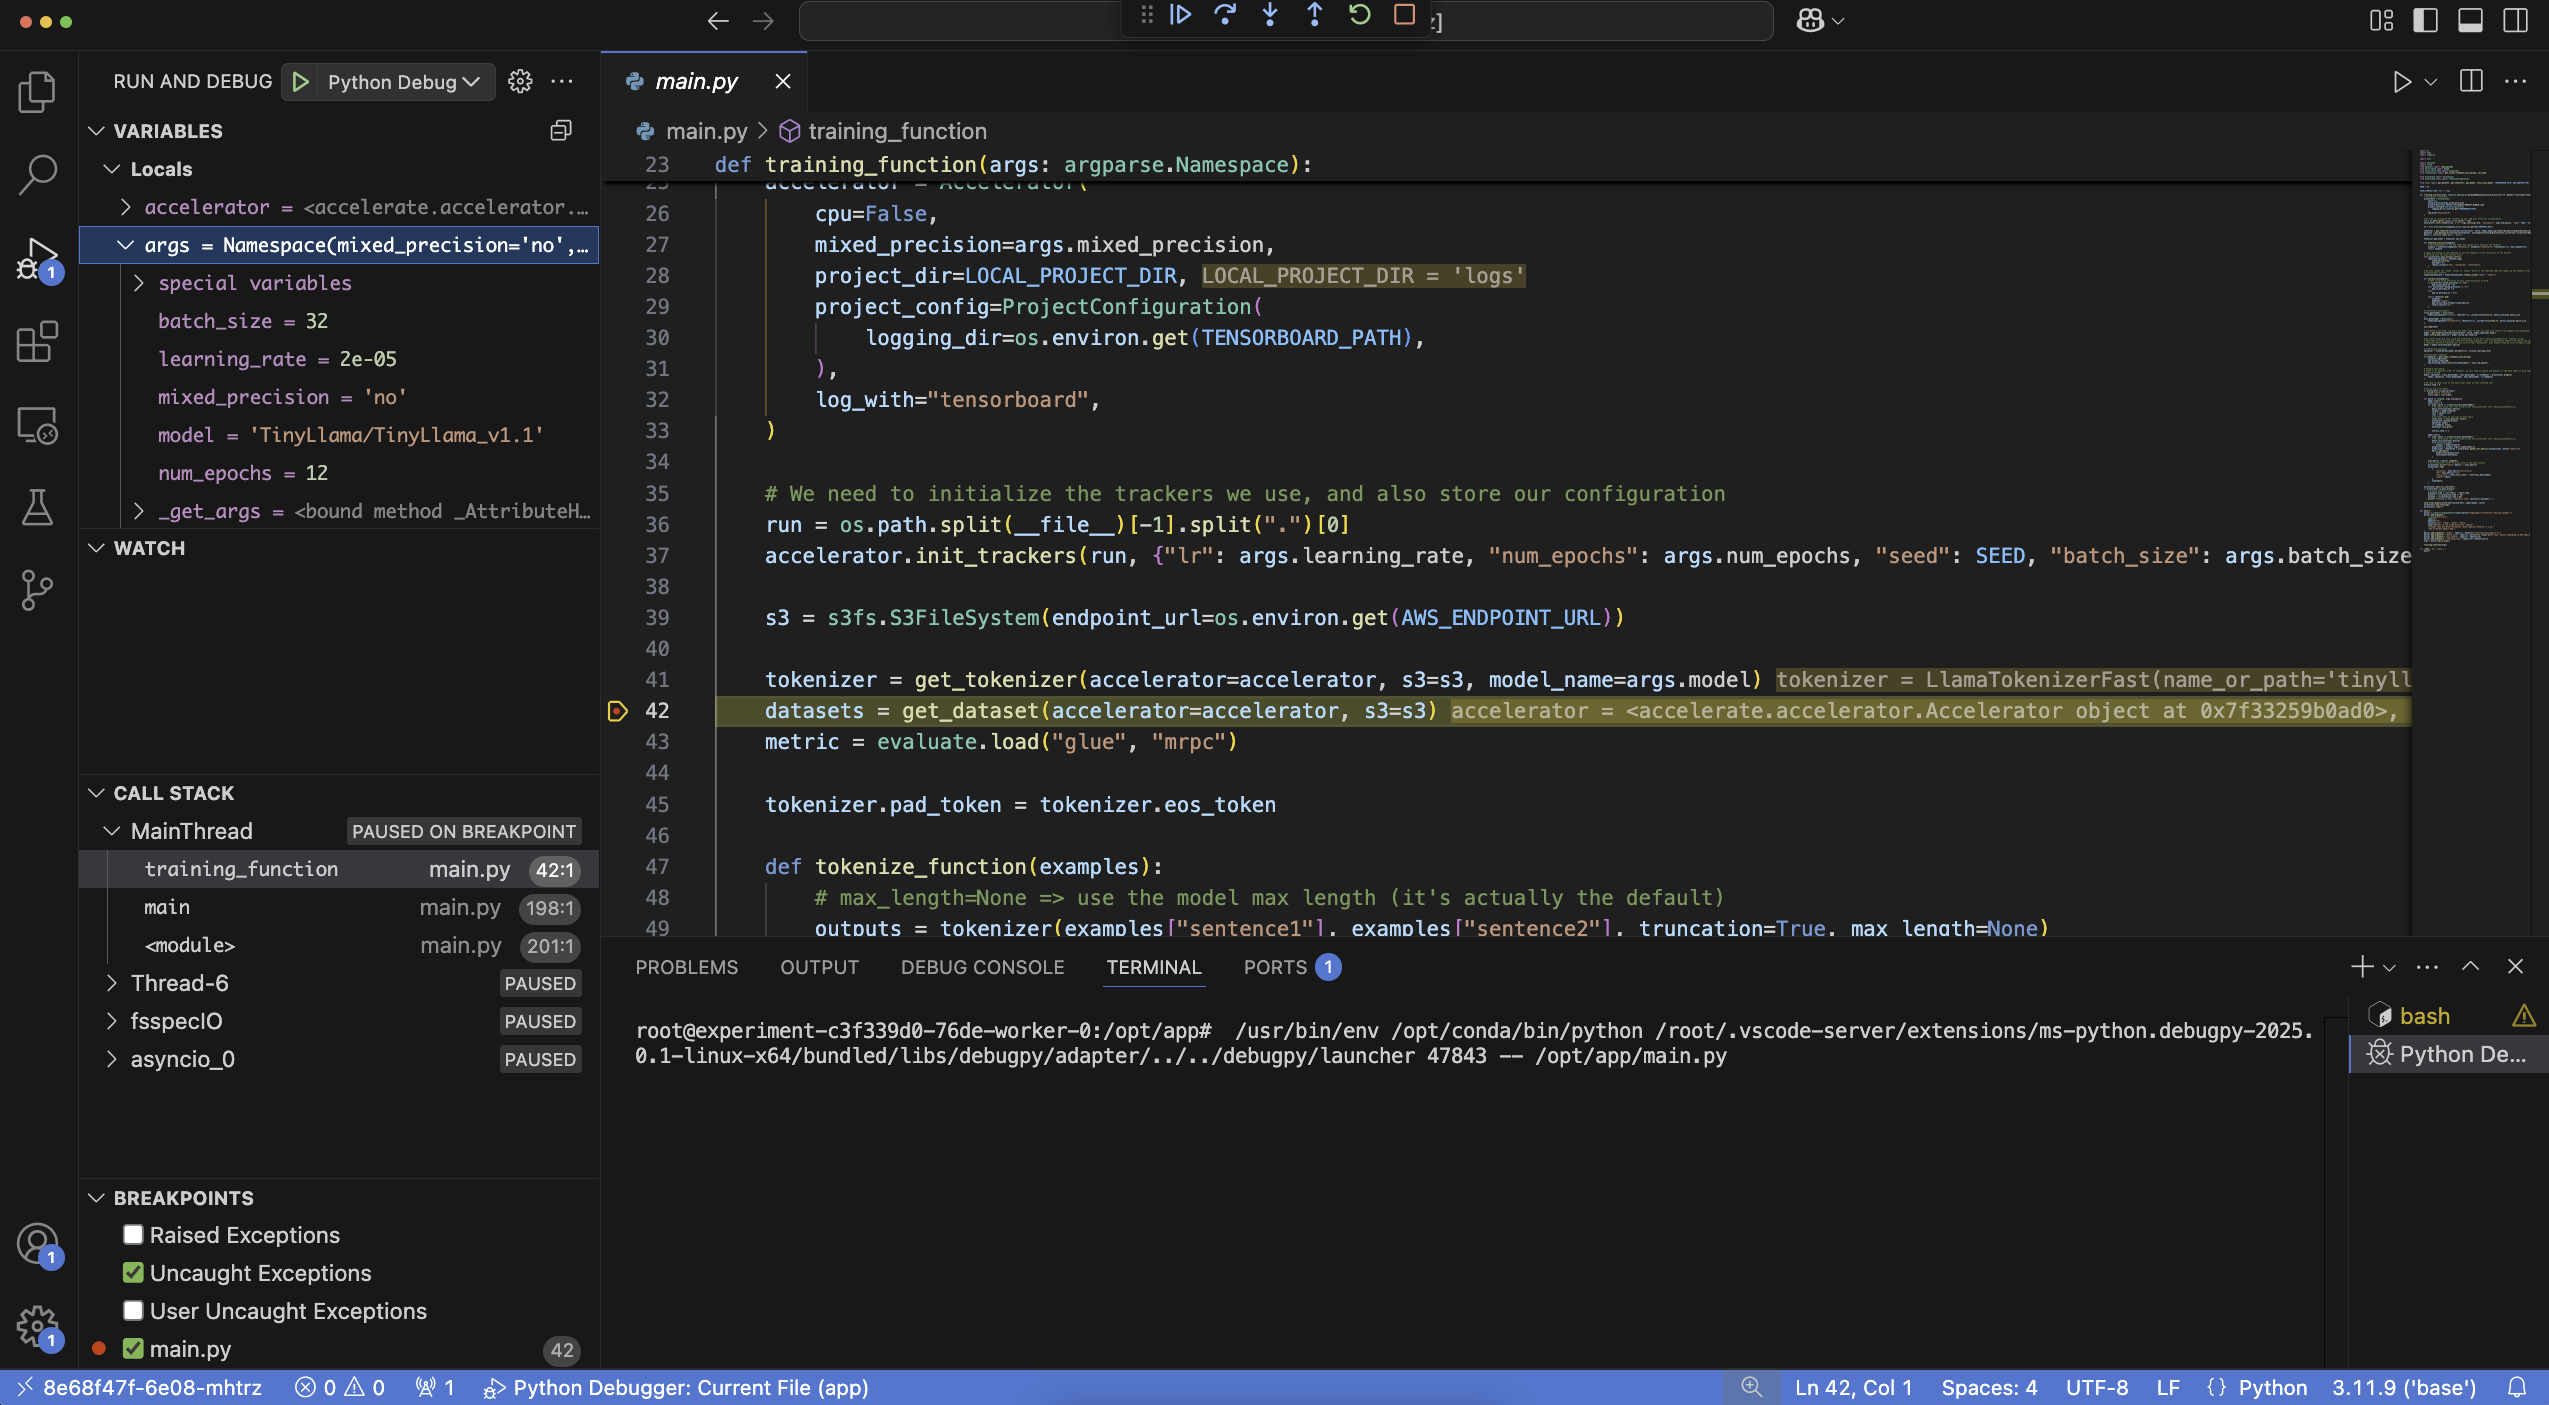
Remote extensions — such as the official Python extension — can also be installed to run the debugger against the code:
Known issues
Cursor extension
Cursor removed the "Remote - Tunnels" extension from its marketplace, which breaks the Cursor setup. Some users have reported workarounds that allow installing it anyway:
Solution #1 — install the extension manually
- Download the extension package:
curl -L "https://ms-vscode.gallery.vsassets.io/_apis/public/gallery/publisher/ms-vscode/extension/remote-server/latest/assetbyname/Microsoft.VisualStudio.Services.VSIXPackage" --output remote-server-latest.vsix
- Install it:
cursor --install-extension ./remote-server-latest.vsix
- Open Cursor, press
Ctrl+Shift+P, and typeremote-tunnel. The Remote - Tunnels commands should now appear.
Solution #2 — import from VS Code
In the Extensions panel, use the option to import extensions from VS Code.
If neither solution works, completely uninstalling and reinstalling Cursor may help (reference).
⚠️ Limitations and caveats ⚠️
- The Visual Studio Code server runs for a maximum of 12 hours. Once debugging is complete, it should be cancelled like a regular experiment.
- If the pod is evicted or terminated while a VS Code debug session is open, the logs may incorrectly report
VSCode debug session reached 12h, self-destruct now.. If this message appears unexpectedly, check the Pods tab of the experiment to confirm whether the pod was terminated. - Traffic between the VS Code server running in the experiment and the client (web or desktop app) is tunneled through GitHub or Microsoft.
- When
spec.debug.vscode.enabledistrue, AIchor overwrites the manifest'scommandwith a command that starts the VS Code server, so the manifest's owncommandis not executed.